Second DA Challenge Case 1: Time-Resolved results
This page presents published results for the Time-Resolved case of 2nd DA Challenge Case 1. The link for result submission, as well as details about the test case and rules for result formatting are given there.
Tables can be ordered according to each of the quantities reported. Clicking on an algorithm name in a table will open a page gathering its result, together with information on the submitter.
Definition of performance metrics
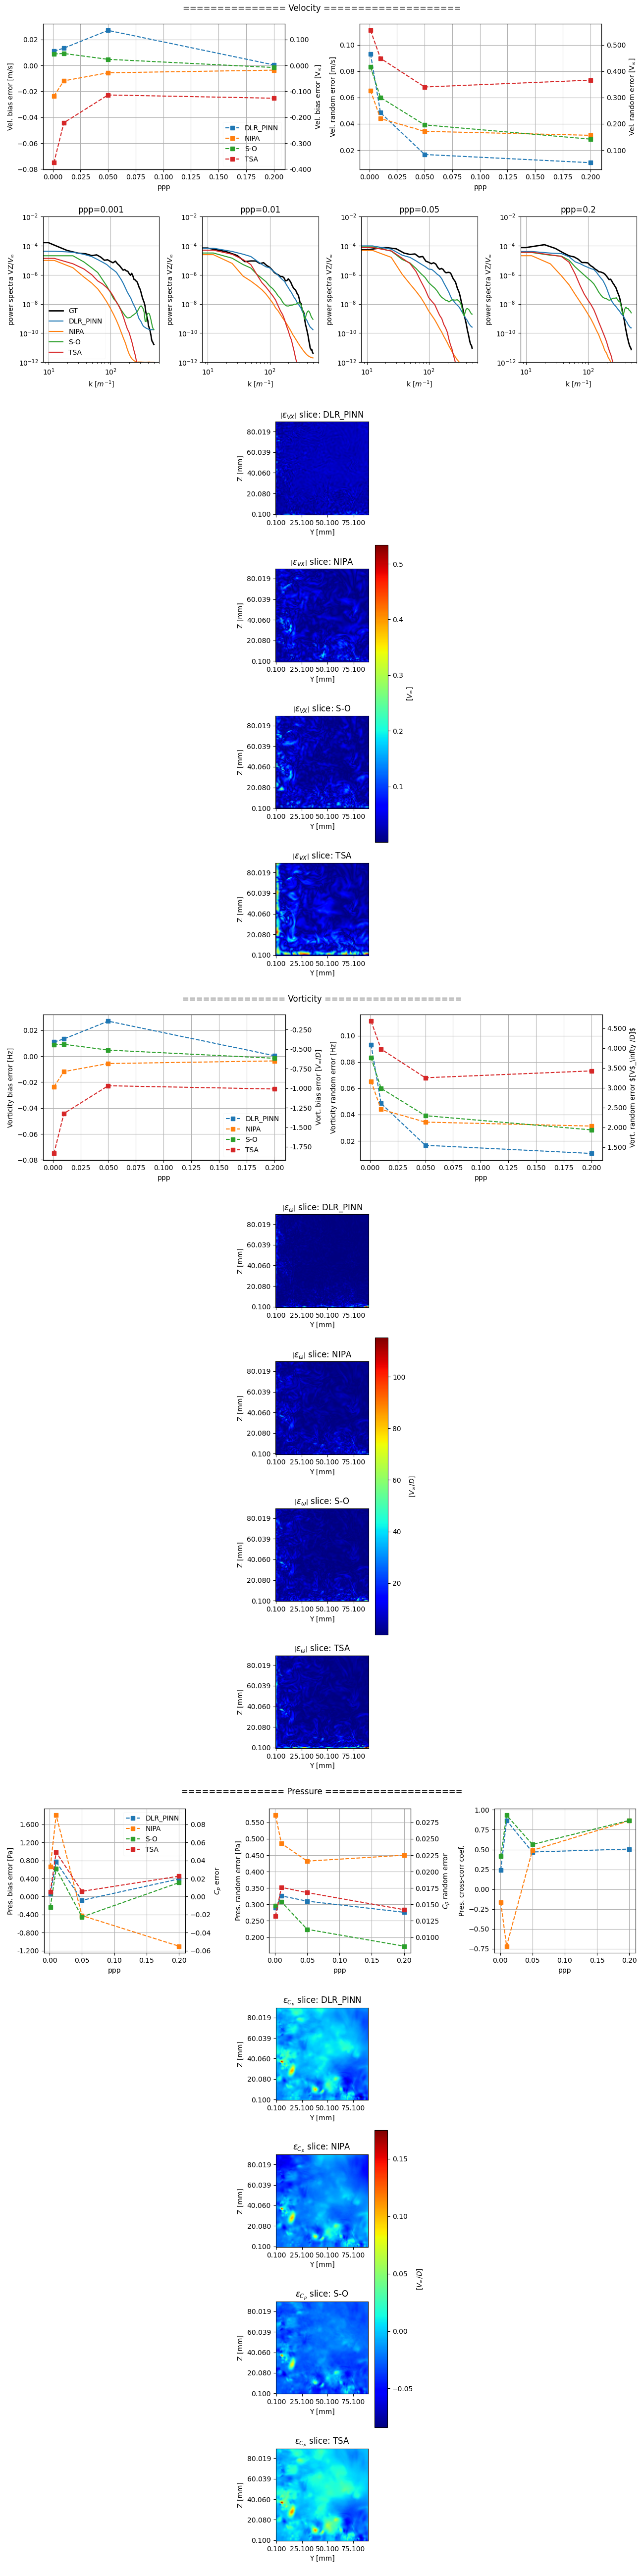
Below, in both the tables and the figures, we provide the bias and random error for:
- the velocity vector magnitude
- the vorticity vector magnitude
- pressure
All quantities are dimensionless, with reference values taken as Vinf = 0.2 m/s for the velocity, Vinf/D (with D = 0.1 m the channel half-width) for the vorticity, and Vinf2/D for the acceleration. For pressure, we also provide the correlation coefficient between submitted result and ground truth.
Below the tables, several groups of figures compare these quantities among participants, as well as obtained streamwise velocity spectra. Additionally, several groups of figures show error slices of streamwise velocity, vorticity and pressure at a selected test point.
For comparison, we provide results obtained by a simple linear interpolation ('Lin. interp'). These are obtained by interpolating towards the output mesh the ground truth at the particles' positions, for each of the requested quantities (velocity components, velocity gradient tensor, pressure).
| Algorithm Sort descending | Institution | Vel. bias | Vel. random error | Vort. bias | Vort. random error | Pres. bias | Pres. random error | Pres. corr. coef. |
|---|---|---|---|---|---|---|---|---|
| AUPINN | Auburn University | -0.0157 | 0.0864 | -6.9 | 9.42 | -0.0367 | 0.0194 | -0.483 |
| DLR-PINN | DLR | -0.0031 | 0.0783 | -1.28 | 6.62 | -0.04 | 0.0156 | -0.628 |
| FF3_lin | DLR | -0.0233 | 0.125 | -3.91 | 7.33 | -0.0297 | 0.0161 | |
| FF3_nonlin | DLR | -0.0233 | 0.125 | -3.91 | 7.33 | -0.0297 | 0.0161 | |
| FF3_nonlin@DaVis | LaVision GmbH | -0.0285 | 0.116 | -3.12 | 7.94 | -0.027 | 0.016 | 0.37 |
| Lin.Interp | N/A | -0.0228 | 0.0879 | -2.9 | 9.16 | -0.00193 | 0.0132 | 0.919 |
| MTA | Dantec Dynamics | -0.0208 | 0.0948 | -3.16 | 7.16 | -0.0168 | 0.0171 | 0.74 |
| NIPA | Penn State | -0.00932 | 0.065 | -3.86 | 6.16 | -0.0525 | 0.0369 | -0.496 |
| nudging | ONERA | 0.012 | 0.0917 | -1.7 | 6.83 | -0.0484 | 0.0161 | -0.732 |
| PIGLET-LINEAR | University of Southampton | -0.000943 | 0.0568 | -3.41 | 5.42 | -0.0357 | 0.0131 | -0.405 |
| PIGLET-NONLIN | University of Southampton | -0.000555 | 0.0563 | -3.36 | 5.38 | -0.0323 | 0.0135 | -0.0641 |
| PII | Dantec Dynamics | -0.021 | 0.0964 | -3 | 7.19 | -0.00443 | 0.0198 | 0.804 |
| TUB_PINN | TU Berlin;TU Delft;Tohoku University | -0.00525 | 0.0659 | -3.35 | 6.04 | -0.0183 | 0.0235 | 0.492 |
| Algorithm Sort descending | Institution | Vel. bias | Vel. random error | Vort. bias | Vort. random error | Pres. bias | Pres. random error | Pres. corr. coef. |
|---|---|---|---|---|---|---|---|---|
| AUPINN | Auburn University | -0.00322 | 0.0405 | -2.17 | 7.93 | 0.00675 | 0.0142 | 0.697 |
| DLR-PINN | DLR | -0.000653 | 0.0361 | -0.478 | 5.14 | 0.00644 | 0.0139 | 0.707 |
| FF3_lin | DLR | -0.00174 | 0.0443 | -1.17 | 5.31 | 0.0171 | 0.0129 | |
| FF3_nonlin | DLR | -0.00157 | 0.044 | -1.1 | 5.25 | -0.014 | 0.027 | 0.69 |
| FF3_nonlin@DaVis | LaVision GmbH | -0.00956 | 0.0574 | -1.82 | 6.92 | 0.0117 | 0.00913 | 0.793 |
| Lin.Interp | N/A | -0.0113 | 0.0513 | -2.35 | 8.84 | 0.000382 | 0.0067 | 0.95 |
| MTA | Dantec Dynamics | -0.00645 | 0.0477 | -1.73 | 6.02 | 0.0245 | 0.00973 | -0.266 |
| NIPA | Penn State | -0.00289 | 0.0385 | -2.68 | 5.00 | 0.0679 | 0.0192 | -0.683 |
| nudging | ONERA | 0.0137 | 0.0553 | -1.27 | 5.89 | -0.0086 | 0.012 | 0.833 |
| PIGLET-LINEAR | University of Southampton | -0.0012 | 0.0351 | -1.93 | 4.86 | 0.0104 | 0.00865 | 0.868 |
| PIGLET-NONLIN | University of Southampton | -0.000611 | 0.034 | -1.71 | 4.95 | 0.0146 | 0.0108 | 0.531 |
| PII | Dantec Dynamics | -0.00554 | 0.0493 | -1.42 | 6.04 | 0.0258 | 0.011 | -0.245 |
| TUB_PINN | TU Berlin;TU Delft;Tohoku University | -0.000911 | 0.0347 | -1.62 | 4.79 | 0.0132 | 0.00982 | 0.801 |
| Algorithm Sort descending | Institution | Vel. bias | Vel. random error | Vort. bias | Vort. random error | Pres. bias | Pres. random error | Pres. corr. coef. |
|---|---|---|---|---|---|---|---|---|
| AUPINN | Auburn University | -0.00128 | 0.0255 | -2.11 | 5.45 | -0.00686 | 0.0129 | -0.0192 |
| DLR-PINN | DLR | 0.0000792 | 0.0155 | -0.491 | 3.32 | -0.0117 | 0.0135 | -0.0702 |
| FF3_lin | DLR | -0.000622 | 0.0271 | -0.779 | 4.23 | -0.00504 | 0.0134 | |
| FF3_nonlin | DLR | -0.000893 | 0.027 | -0.811 | 4.23 | 0.00757 | 0.0164 | 0.608 |
| FF3_nonlin@DaVis | LaVision GmbH | -0.00239 | 0.0288 | -1.5 | 4.84 | -0.00734 | 0.00807 | 0.653 |
| Lin.Interp | N/A | -0.00639 | 0.0367 | -2.24 | 6.91 | -0.000164 | 0.0055 | 0.925 |
| MTA | Dantec Dynamics | -0.00268 | 0.0281 | -1.35 | 4.58 | -0.00673 | 0.00907 | 0.622 |
| NIPA | Penn State | -0.00117 | 0.0302 | -2.26 | 4.33 | -0.0803 | 0.0172 | -0.269 |
| nudging | ONERA | 0.00179 | 0.0397 | -1.76 | 5.08 | -0.0149 | 0.0106 | 0.0467 |
| PIGLET-LINEAR | University of Southampton | 0.0000135 | 0.0246 | -1.22 | 4.25 | -0.00777 | 0.00825 | 0.614 |
| PIGLET-NONLIN | University of Southampton | 0.00056 | 0.0242 | -0.729 | 4.23 | -0.00977 | 0.00913 | 0.49 |
| PII | Dantec Dynamics | -0.00171 | 0.0283 | -0.836 | 4.52 | 0.00512 | 0.00956 | 0.717 |
| TUB_PINN | TU Berlin;TU Delft;Tohoku University | -0.000712 | 0.0237 | -1.68 | 4.20 | -0.00444 | 0.00944 | 0.758 |
| Algorithm Sort descending | Institution | Vel. bias | Vel. random error | Vort. bias | Vort. random error | Pres. bias | Pres. random error | Pres. corr. coef. |
|---|---|---|---|---|---|---|---|---|
| AUPINN | Auburn University | -0.00105 | 0.0312 | -2.62 | 4.61 | 0.00604 | 0.0133 | 0.0209 |
| DLR-PINN | DLR | 0.000473 | 0.00989 | -0.507 | 2.28 | -0.0109 | 0.0138 | 0.419 |
| FF3_lin | DLR | -0.000435 | 0.0154 | -0.324 | 3.32 | 0.00548 | 0.0132 | |
| FF3_nonlin | DLR | -0.000567 | 0.0152 | -0.277 | 3.26 | 0.0246 | 0.0122 | -0.0665 |
| FF3_nonlin@DaVis | LaVision GmbH | -0.00157 | 0.0196 | -1.32 | 4.49 | 0.00329 | 0.0075 | 0.884 |
| Lin.Interp | N/A | -0.00434 | 0.0258 | -1.97 | 6.72 | 0.00000351 | 0.00397 | 0.962 |
| MTA | Dantec Dynamics | -0.00229 | 0.0181 | -1.18 | 4.35 | 0.0079 | 0.0082 | 0.608 |
| NIPA | Penn State | -0.000593 | 0.0227 | -1.95 | 3.62 | 0.0463 | 0.0178 | -0.208 |
| nudging | ONERA | -0.00119 | 0.0263 | -1.45 | 4.15 | -0.00894 | 0.00935 | 0.67 |
| PIGLET-LINEAR | University of Southampton | 0.000356 | 0.0175 | -0.698 | 3.92 | -0.00641 | 0.00652 | 0.806 |
| PIGLET-NONLIN | University of Southampton | 0.000823 | 0.0187 | -0.188 | 3.90 | 0.00193 | 0.00902 | 0.766 |
| PII | Dantec Dynamics | -0.00199 | 0.0165 | -0.751 | 4.24 | 0.0223 | 0.00927 | 0.0125 |
| TUB_PINN | TU Berlin;TU Delft;Tohoku University | -0.000861 | 0.0186 | -1.57 | 4.25 | 0.0025 | 0.00889 | 0.848 |